
Smart City
Waste Monitoring Dashboard
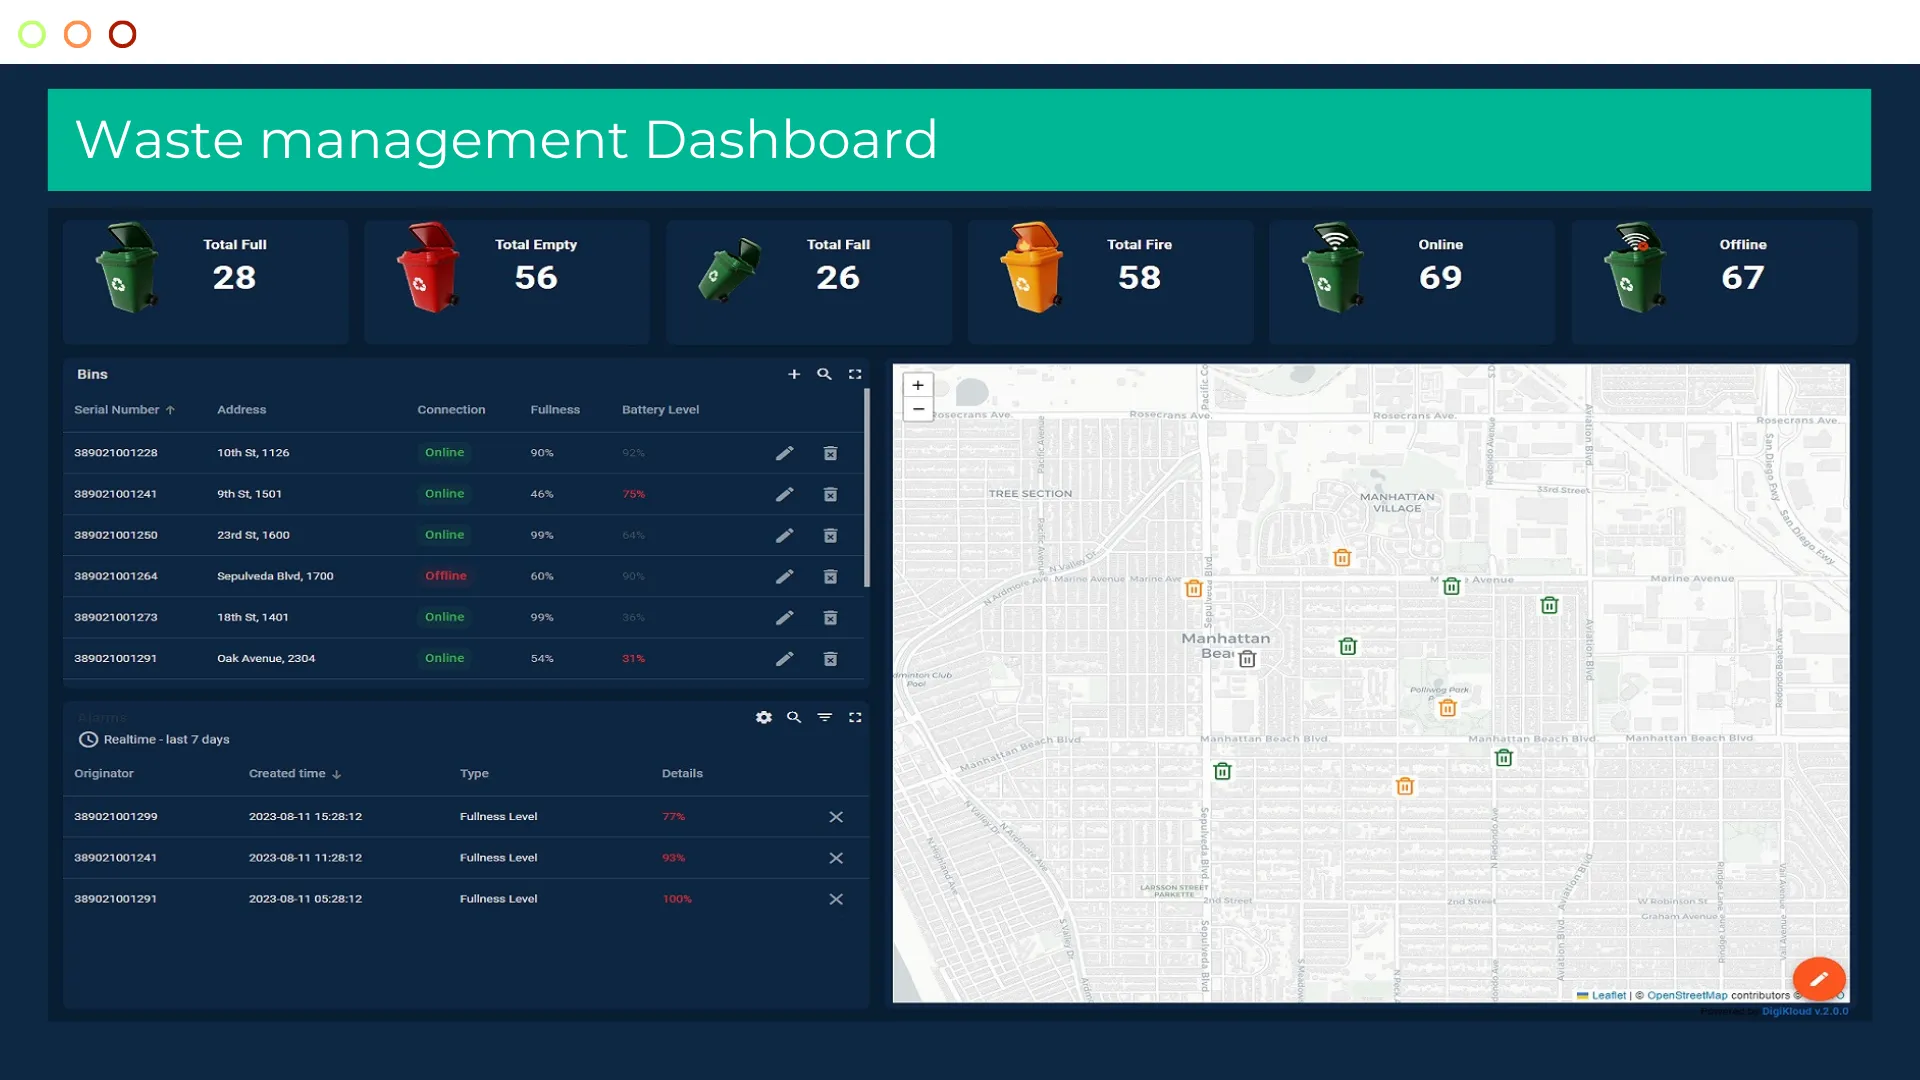
Our waste monitoring dashboard gives municipalities and facility managers real-time visibility into bin fill levels, collection efficiency, and sustainability metrics across their entire network.
8+Dashboard Features
LiveBin Fill Data
24/7Overflow Alerts
Stay informed and efficiently manage waste operations with this comprehensive smart city IoT dashboard template, featuring user-friendly widgets such as live bin fill gauges, GeoMap route overlays, trend charts, and KPI panels that offer in-depth insights into your entire waste management network.
Variables: Bin Fill Level, Collection Route, Recycling Rate, Contamination Index, Battery Status, Zone Scheduling, Municipal KPIs
Dashboard Features
- Real-time bin fill-level map view
- Collection route optimization engine
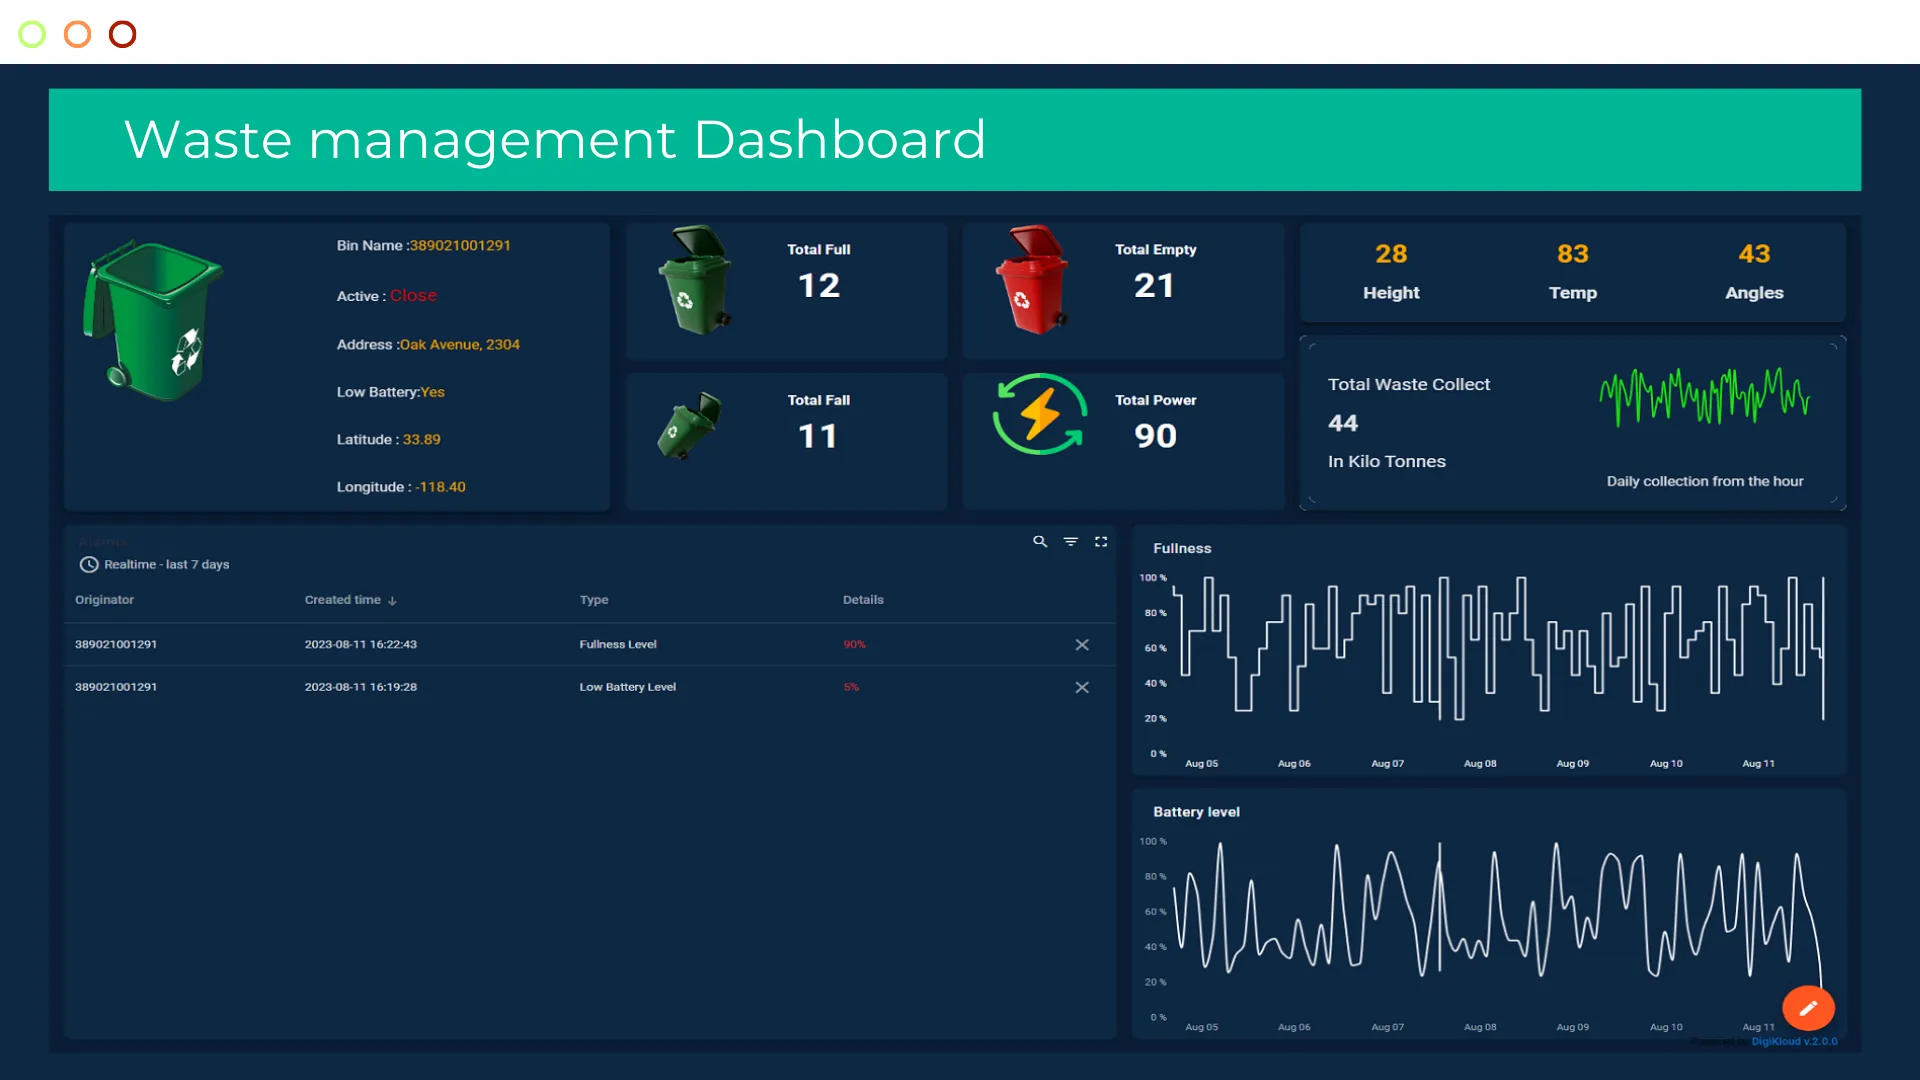
- Historical fill-rate trend analysis
- Sensor battery and connectivity status
- Recycling rate and contamination tracking
- Zone-based collection scheduling
- Alert thresholds for overflow prevention
- KPI reports for municipal reporting
Technology Stack
Sensor ProtocolLoRaWAN / NB-IoT
Network ServerChirpStack / AWS IoT
Data PipelineNode-RED + Telegraf
Time-Series DBInfluxDB
VisualizationGrafana + GeoMap
Build. Monitor. Optimize.
Deliver exceptional IoT experiences for your smart city infrastructure with DiGiKloud.
Start Building →