
Solar Monitoring
Solar Monitoring Dashboard
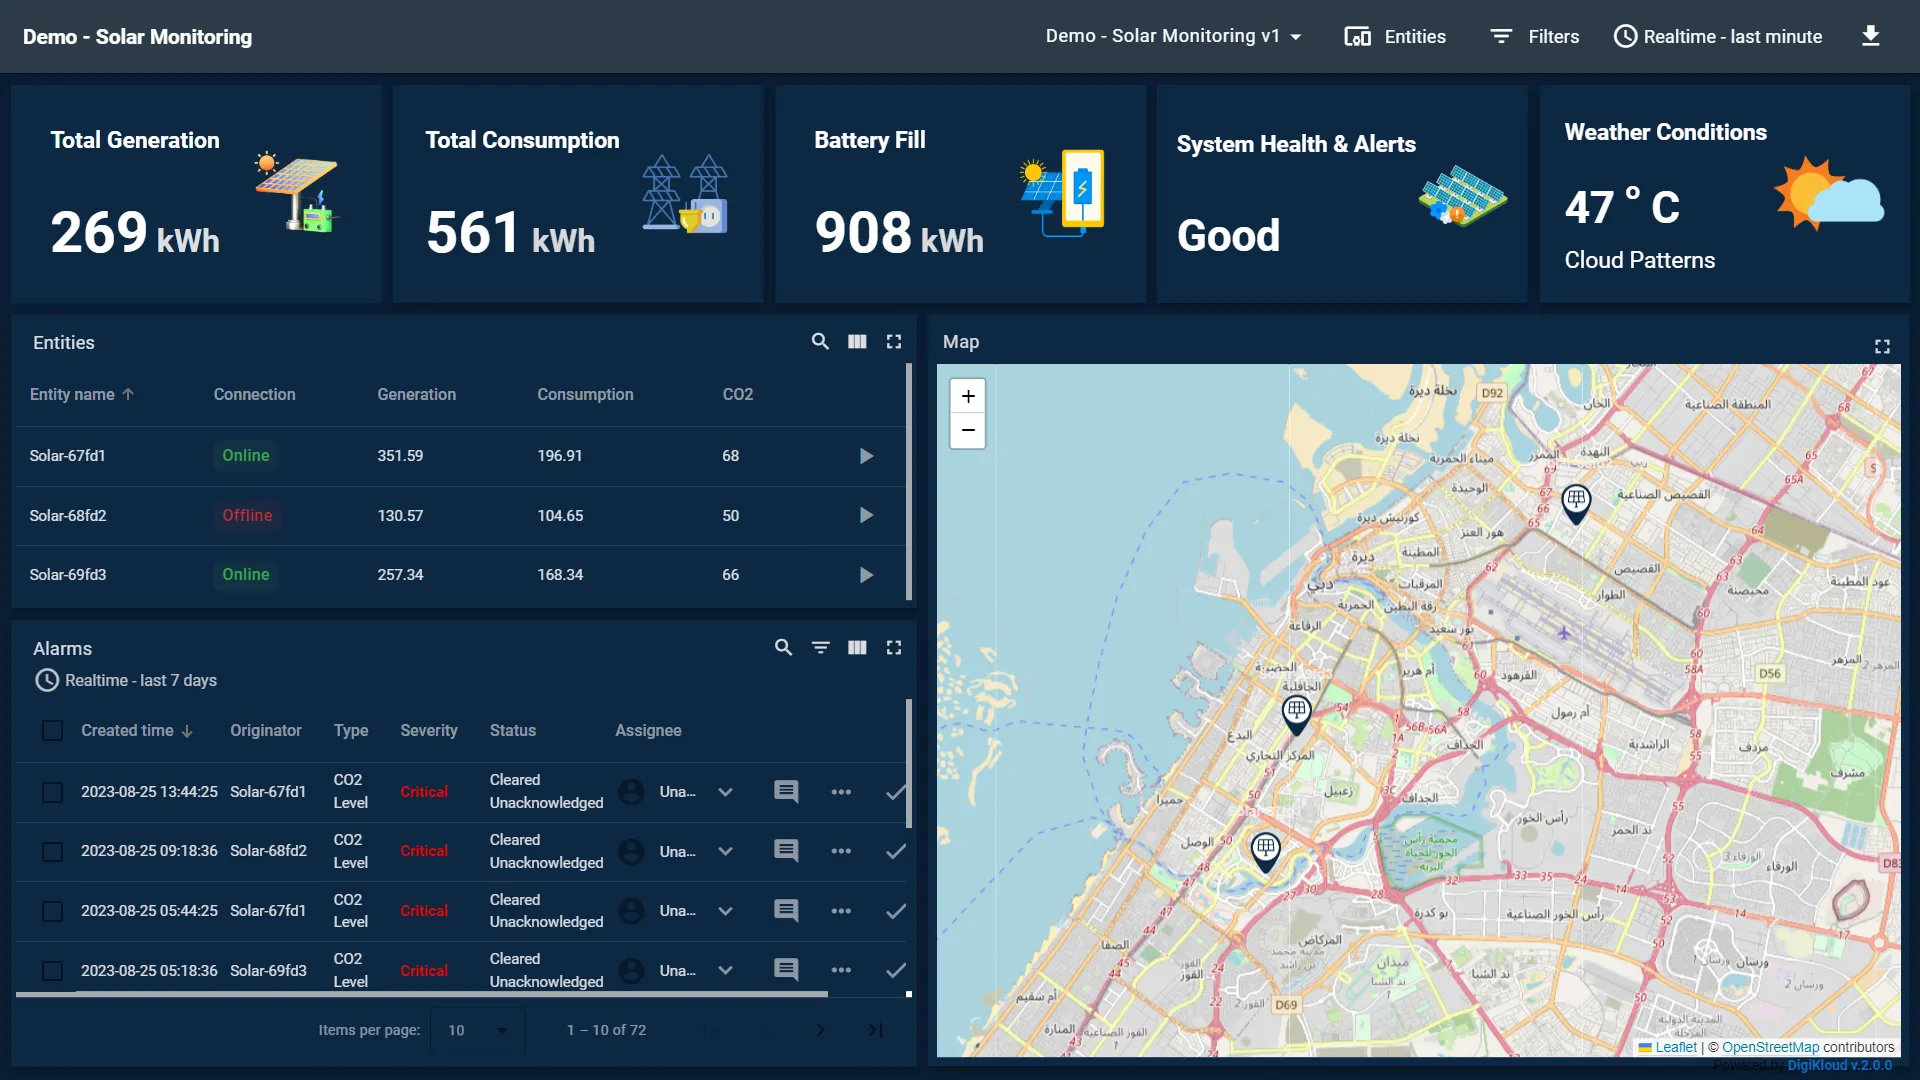
Harness the power of the sun, intelligently. Real-time visibility into energy production, panel-level heatmaps, inverter health, and automated fault detection — all within a single unified dashboard tailored for photovoltaic plant management.
8+Dashboard Features
LiveEnergy Data
24/7Fault Monitoring
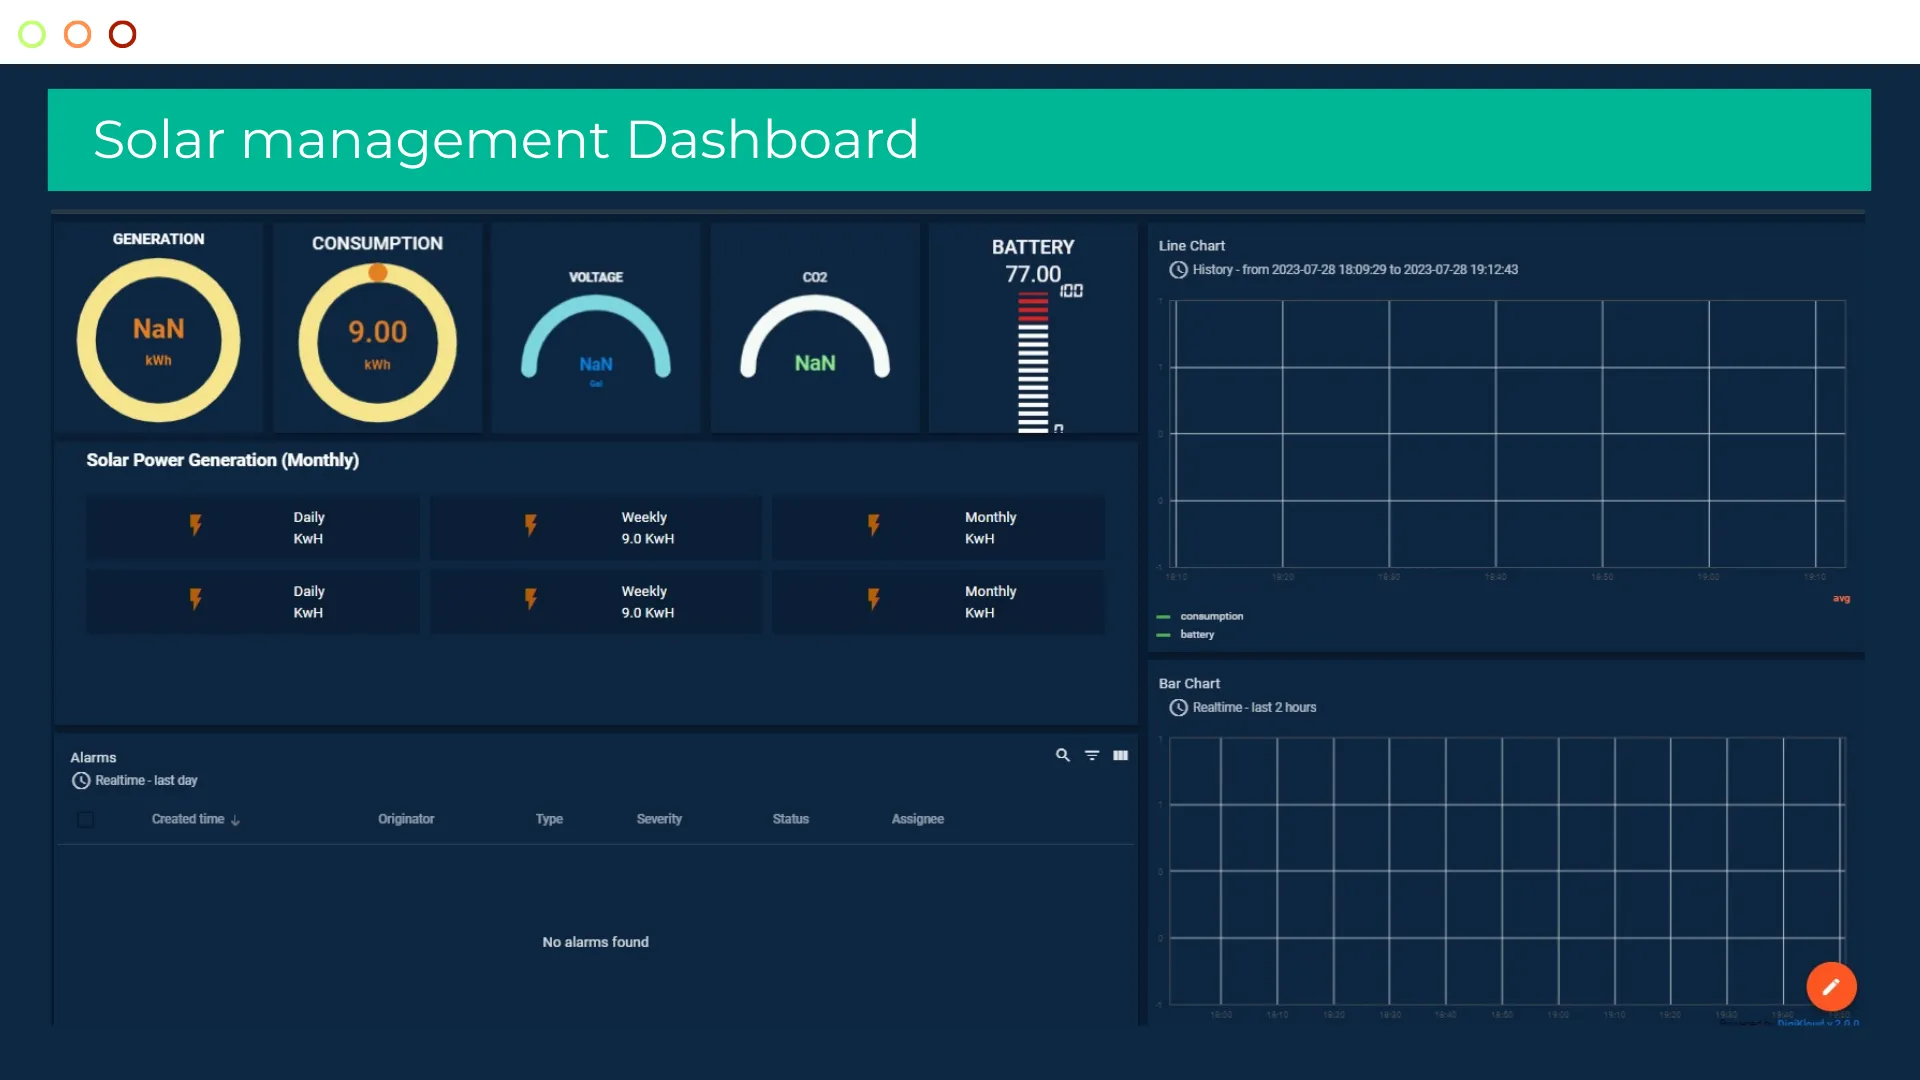
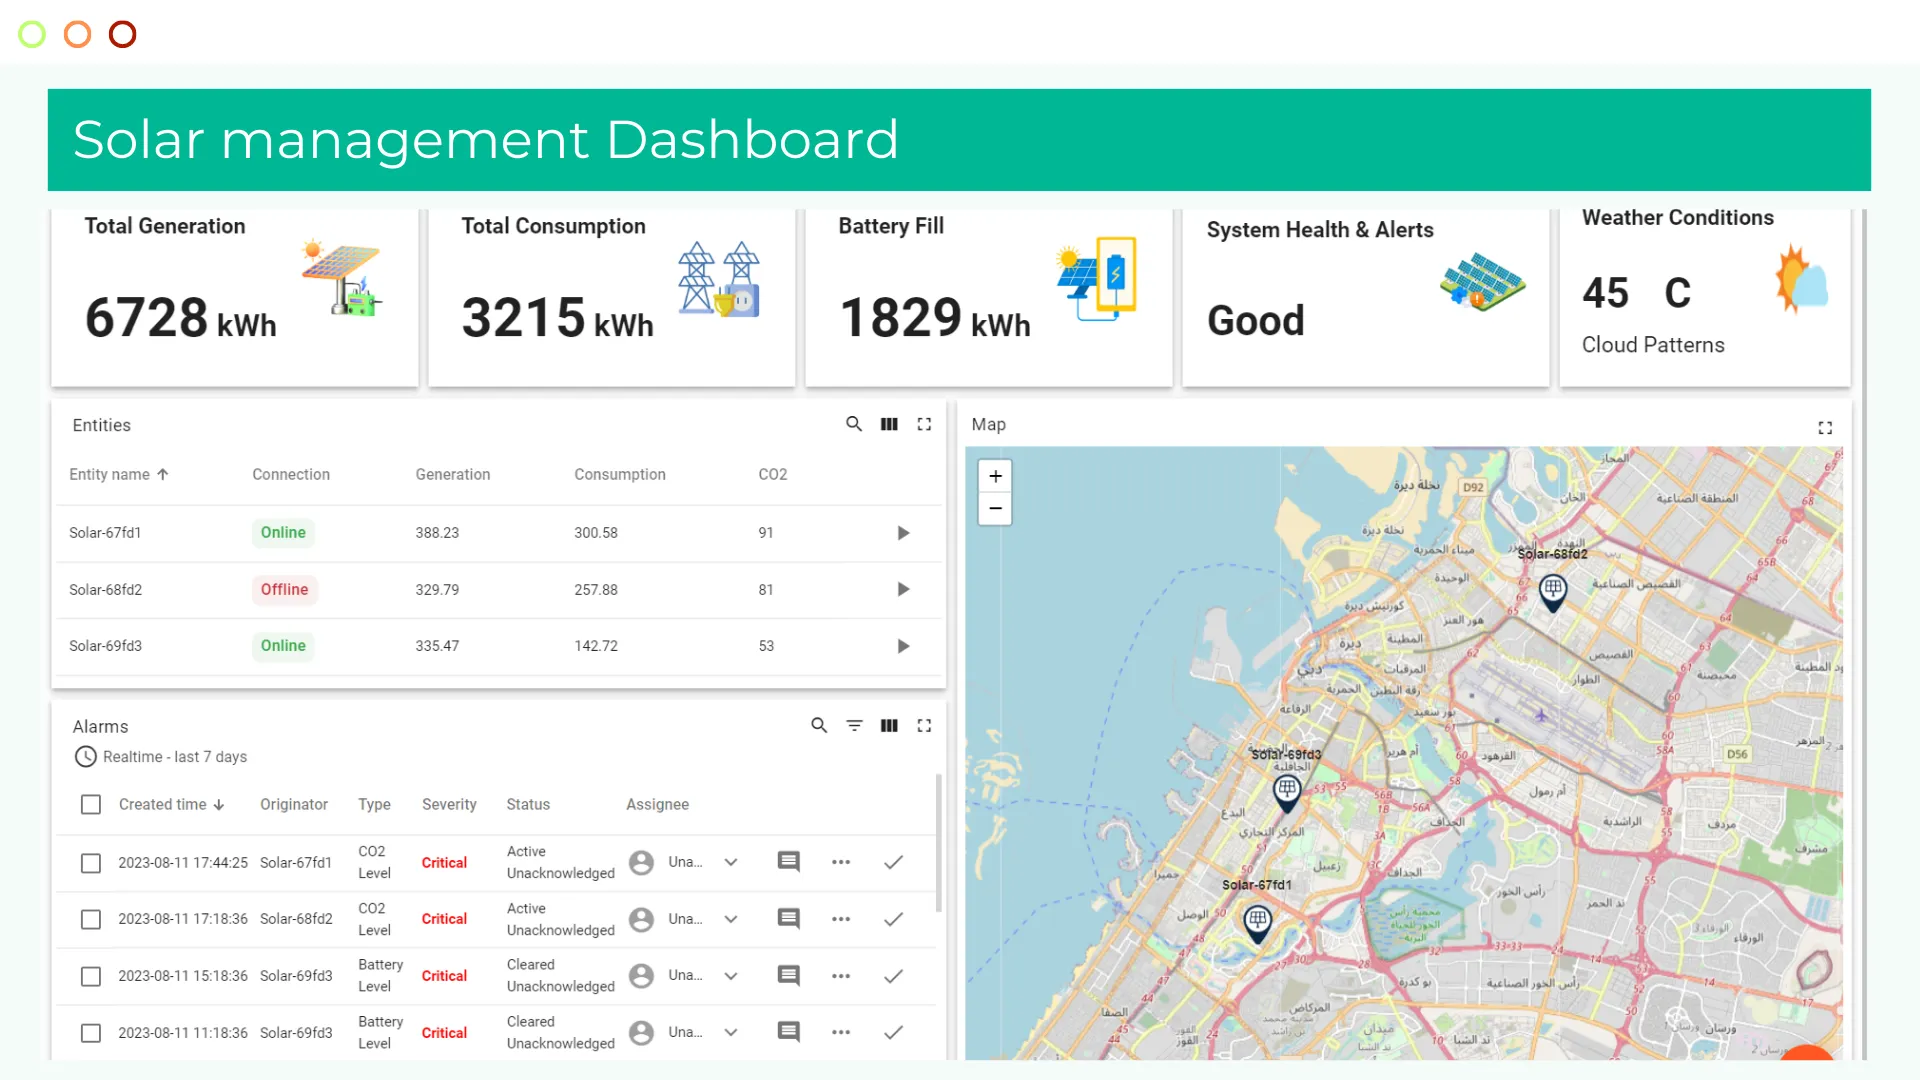
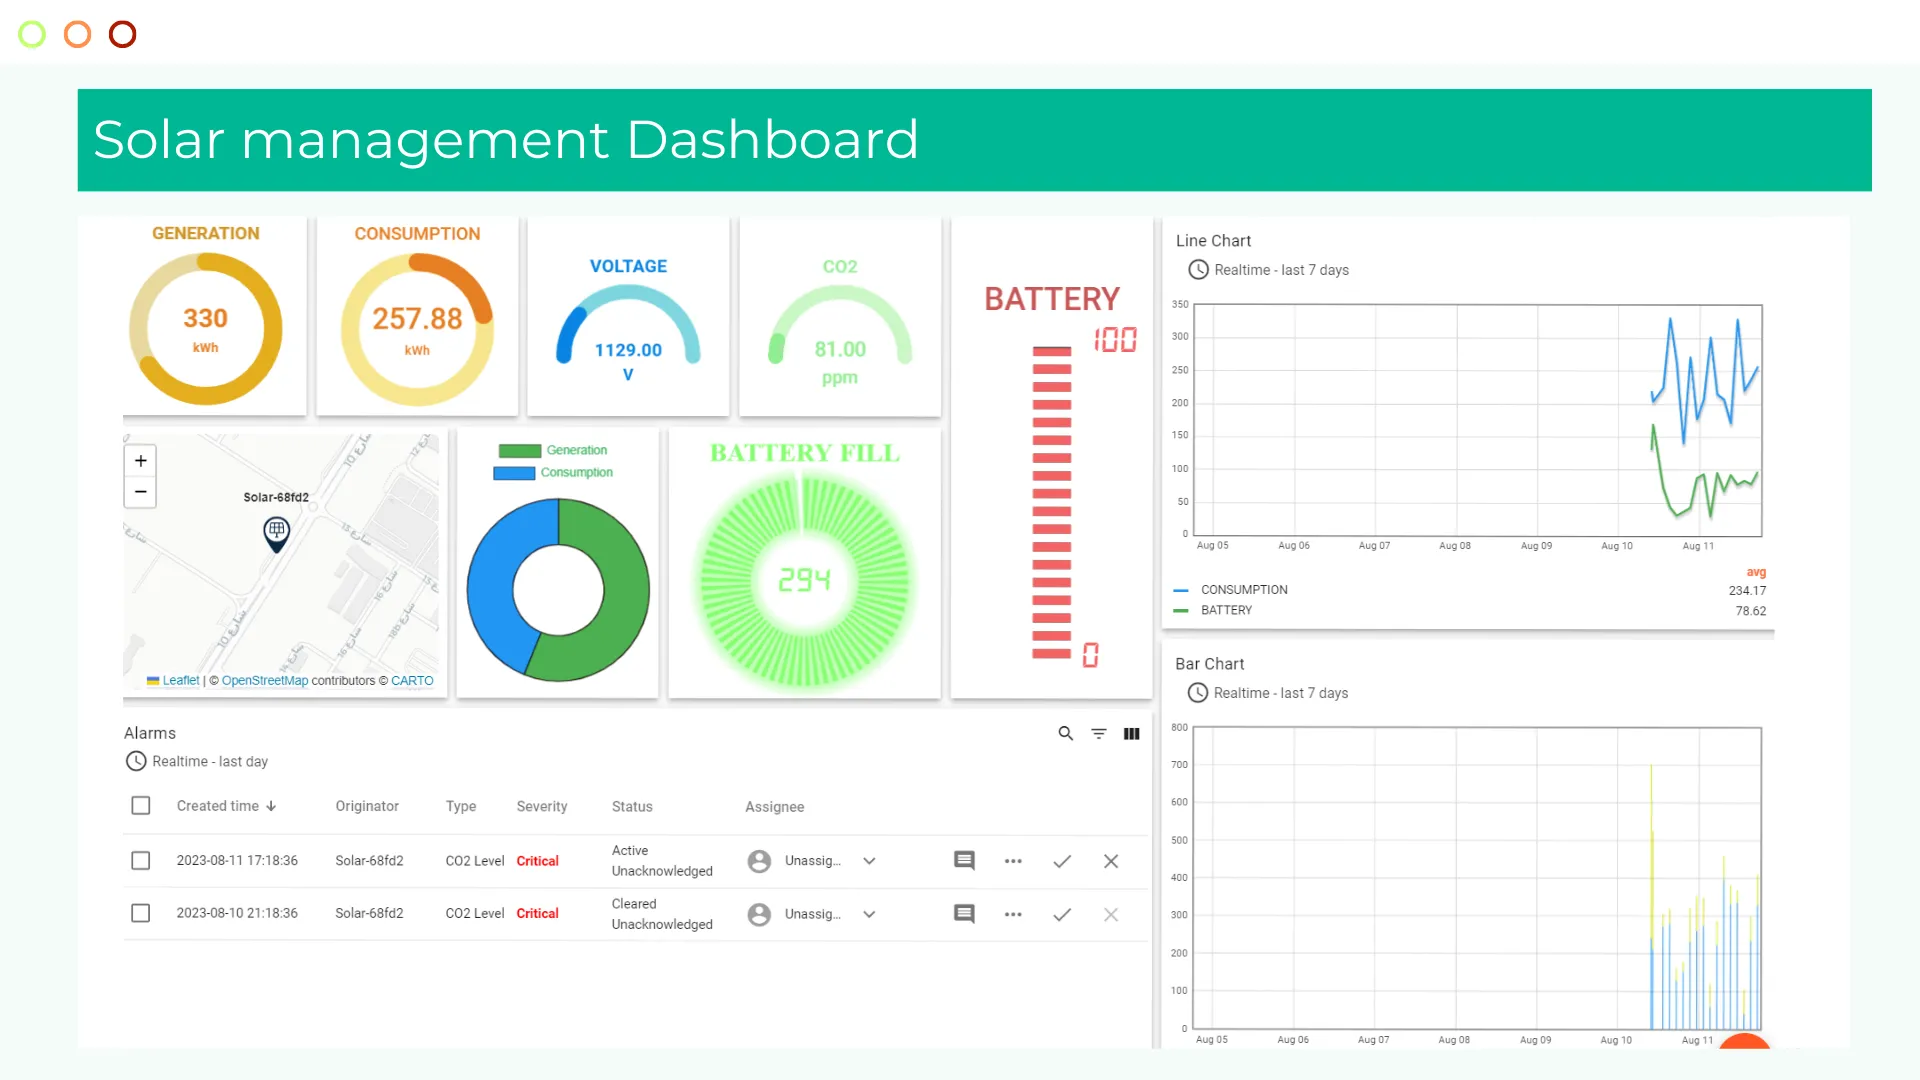
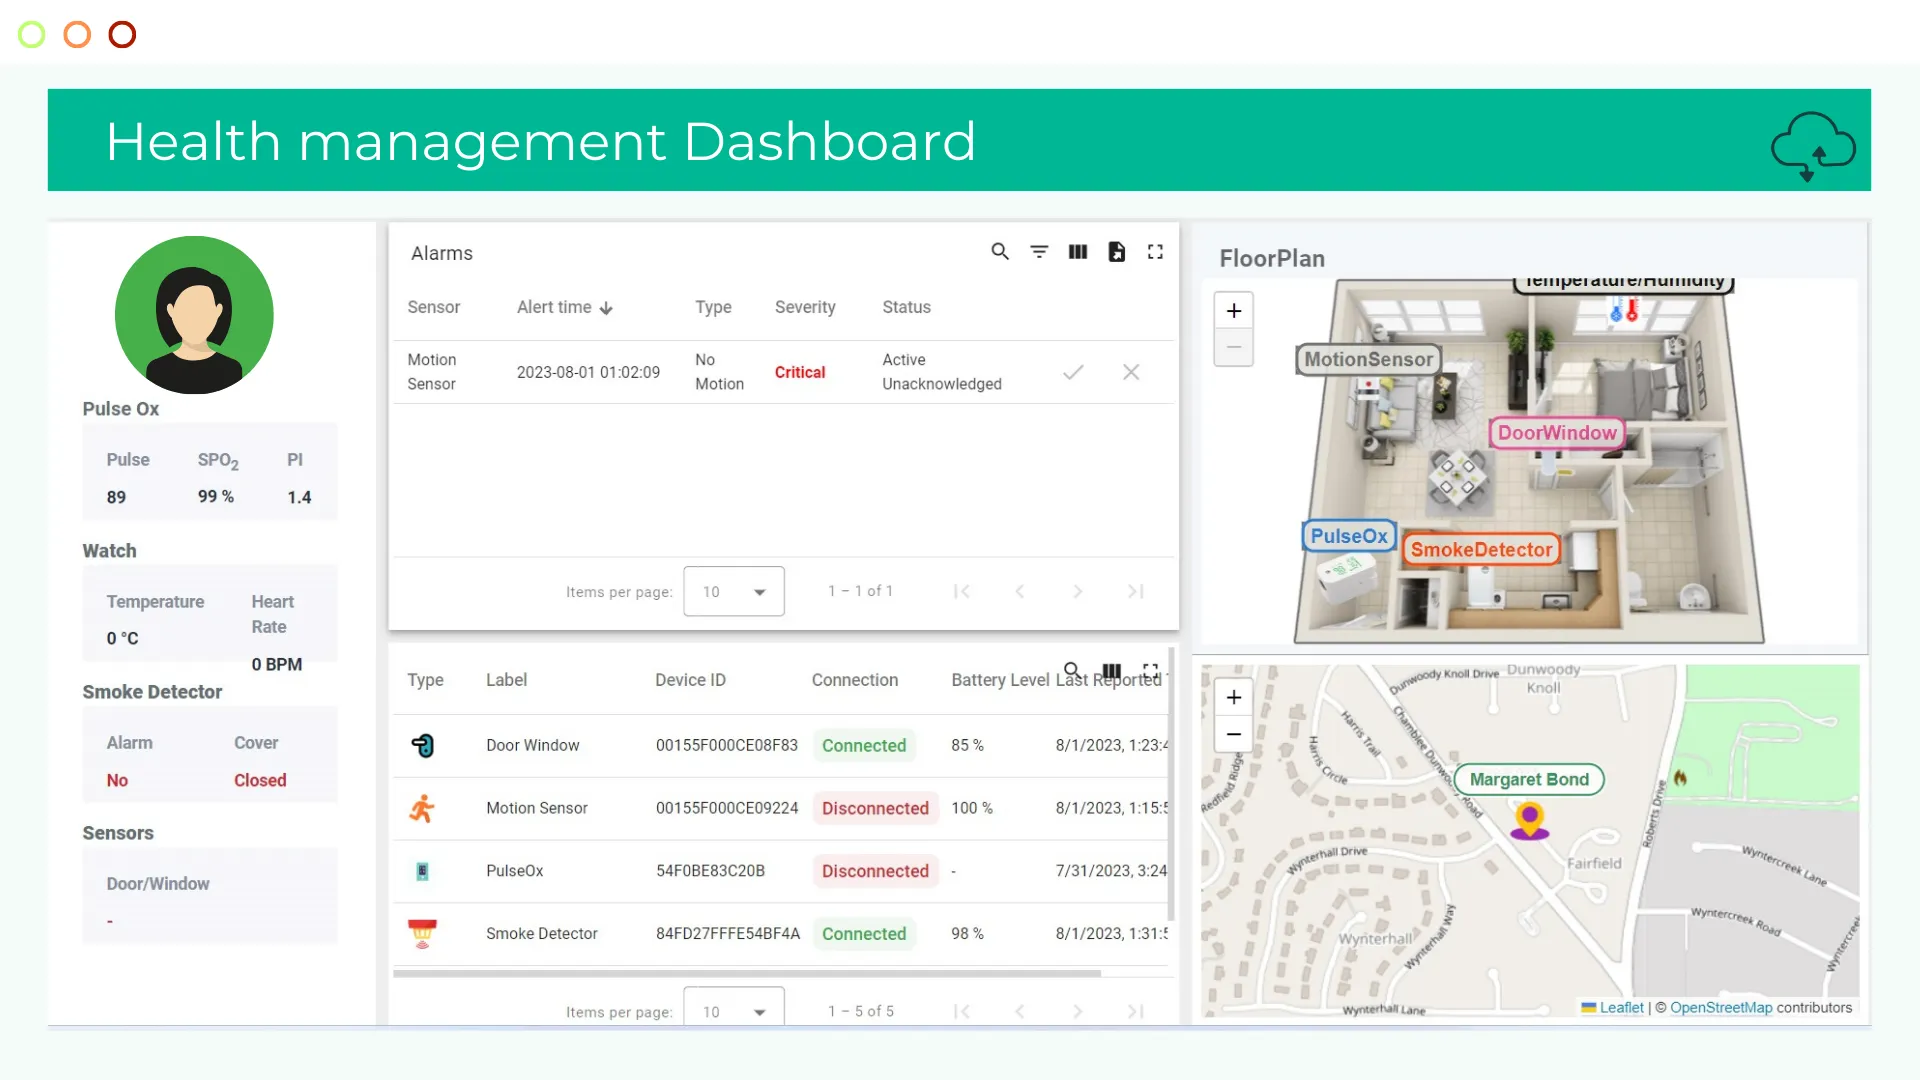
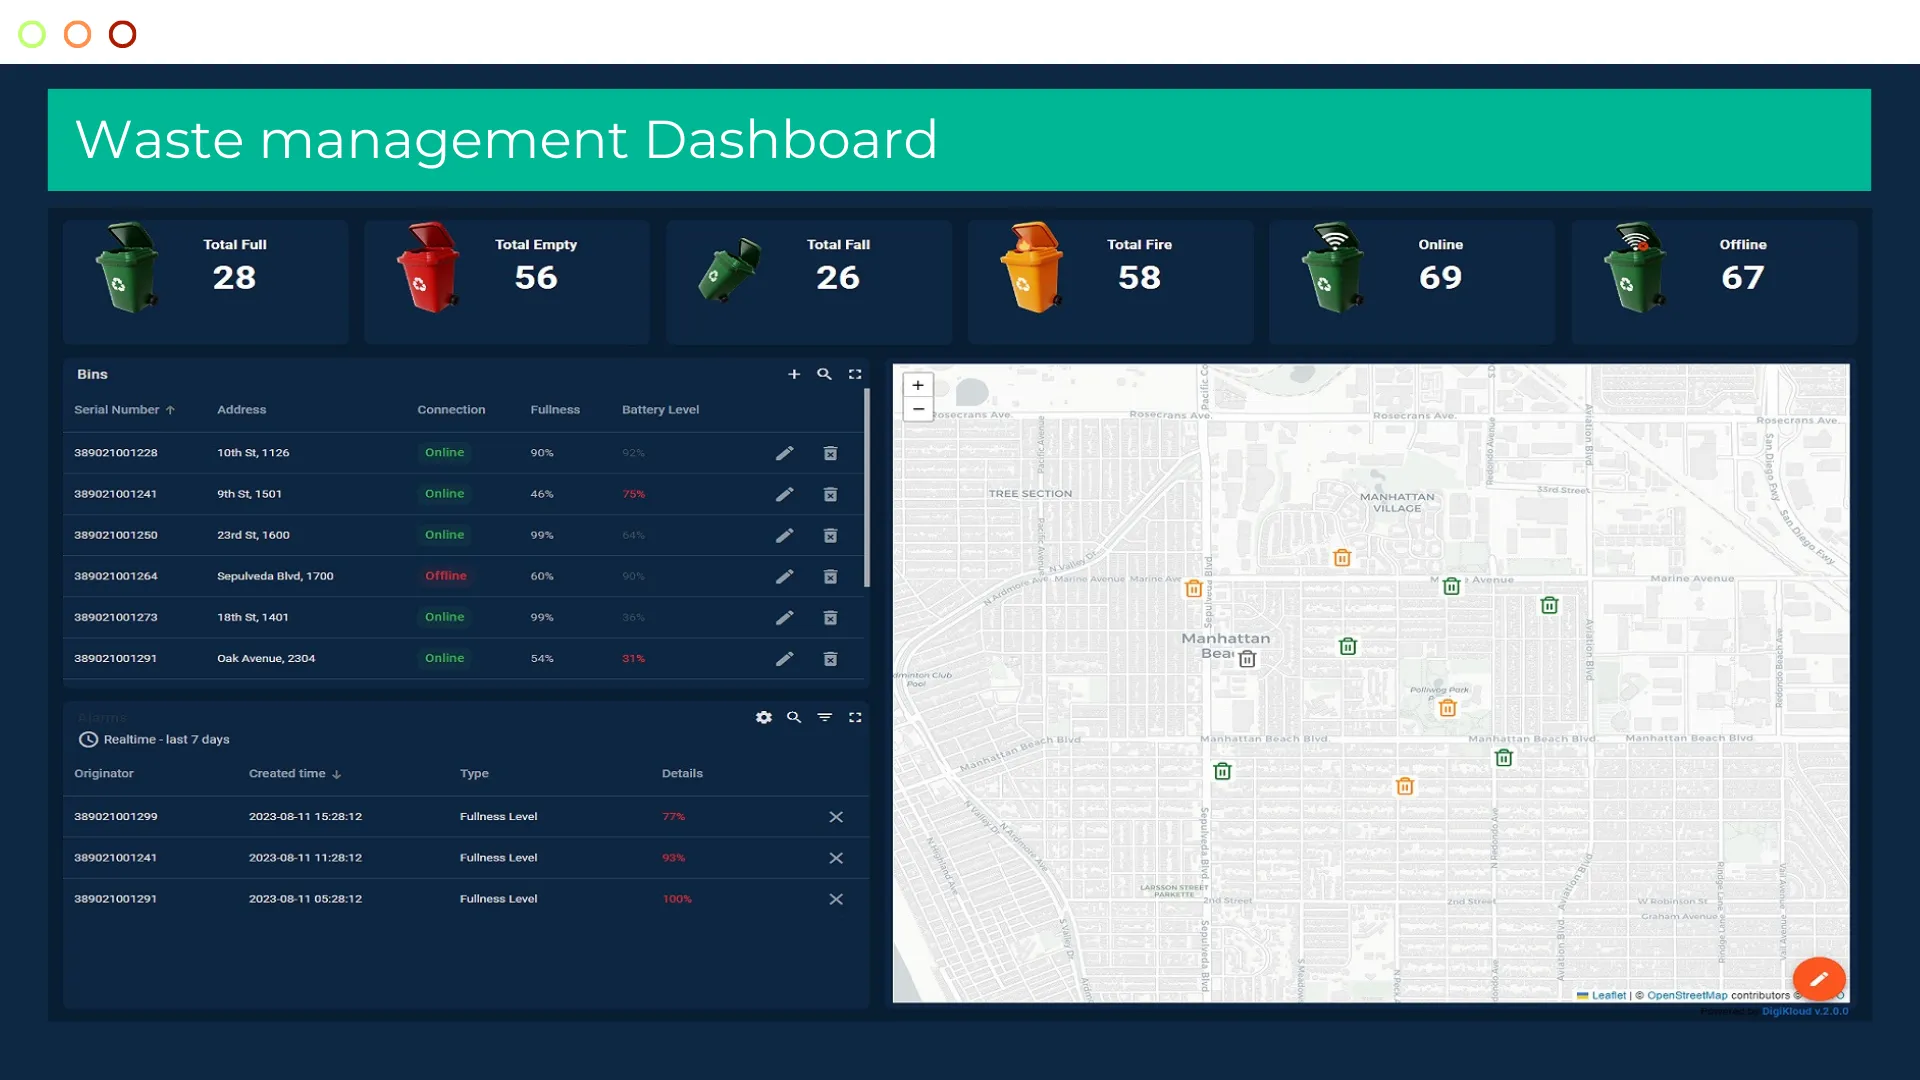
Stay informed and efficiently manage energy decisions with this comprehensive solar IoT dashboard template, featuring user-friendly widgets such as live gauges, area charts, panel heatmaps, and icon widgets that offer in-depth insights into your photovoltaic installation.
Variables: Live Energy (kW & kWh), Condition, Performance Ratio, Wind Speed, Irradiance, Temperature, Humidity
Dashboard Features
- Live energy production monitoring (kW & kWh)
- Panel-level performance heatmap
- Inverter status and fault codes
- PR (Performance Ratio) and CUF tracking
- CO₂ savings and environmental impact
- Weather integration for irradiance data
- Historical trend analysis and export
- Automated fault alerts via email/SMS
Technology Stack
Data CollectionMQTT / Modbus over RS-485
Edge ProcessingNode-RED on Raspberry Pi
Cloud PlatformAWS IoT Core / ThingsKloud
Time-Series DBInfluxDB
VisualizationGrafana
Build. Monitor. Optimize.
Deliver exceptional IoT experiences for your energy infrastructure with DiGiKloud.
Start Building →